- Integrations
- Multitudes
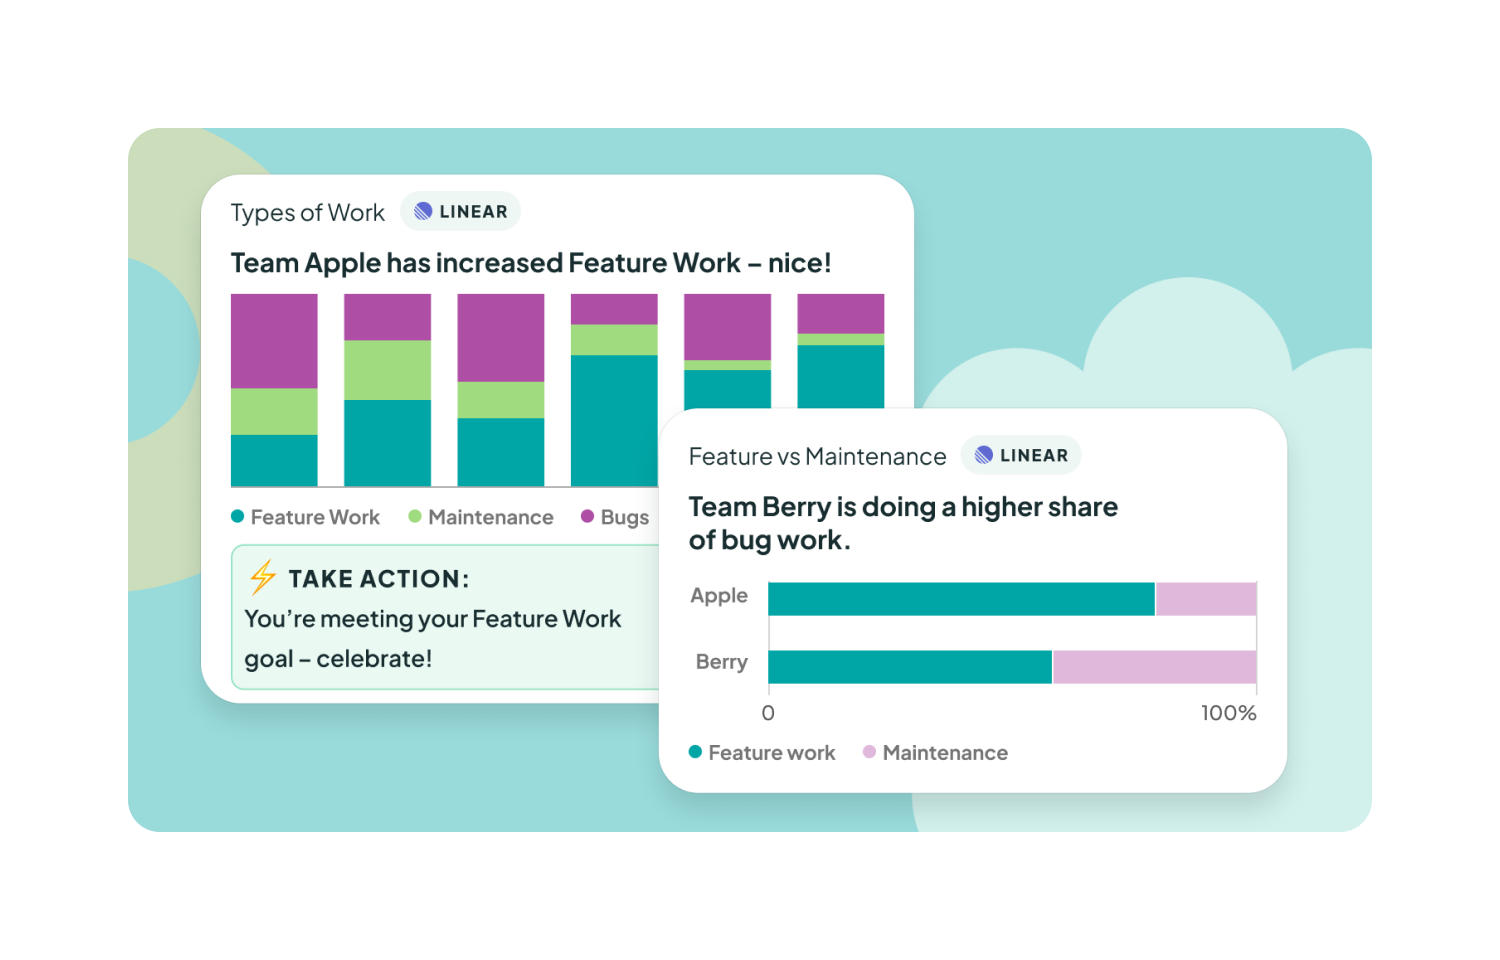
Track the types of work completed by your teams
Overview
The Multitudes integration shows where your team’s time went and what kind of work you’re delivering. By pulling in Linear data and comparing it to your AI activity, we can see how product delivery changes based on different experiments you run. Multitudes then puts this data in your team’s hands with nudges to action, so they can take the lead on their own continuous improvement.
How it works
With this integration, Multitudes will pull in Linear data to give insights on the types of work your team is completing, the investment balance across feature work/maintenance/support/etc, projects delivered in a given time period, cycle time for issues/projects, and more. These charts show completed work based on Linear issues moved to “Done”, and can be viewed by issue count or story points depending on how your team tracks work. You can also customize these charts to match how your team organizes work – changing the bucket names and/or setting up your own rules to bring in issues based on Linear Projects and/or labels.
With the AI impact feature, Multitudes will show how the delivery outcomes you see in Linear data (and in other Multitudes integrations, including version control, incidents data, and more) differ with different AI interventions that you try.
Linear data is processed in Multitudes on an hourly basis.
Configure
In order to install this integration, you must have both Owner or Manager level permissions on Multitudes, and Admin role in Linear. The integration can be configured in Multitudes Settings.
You might be interested in
- Slick Hill Charts synced with your Linear issues for your Shape Up workflow
 Hill Charts by RoutificBy Routific
 - Build custom dashboards and analytics from issue and project data
 Google SheetsBy Linear
 - Connect Linear to Airbyte and consolidate data in data warehouses, lakes, and databases
 AirbyteBy Linear