- Integrations
- Polymer
Ready-made dashboards and out-of-the-box insights for your Linear issues


Overview
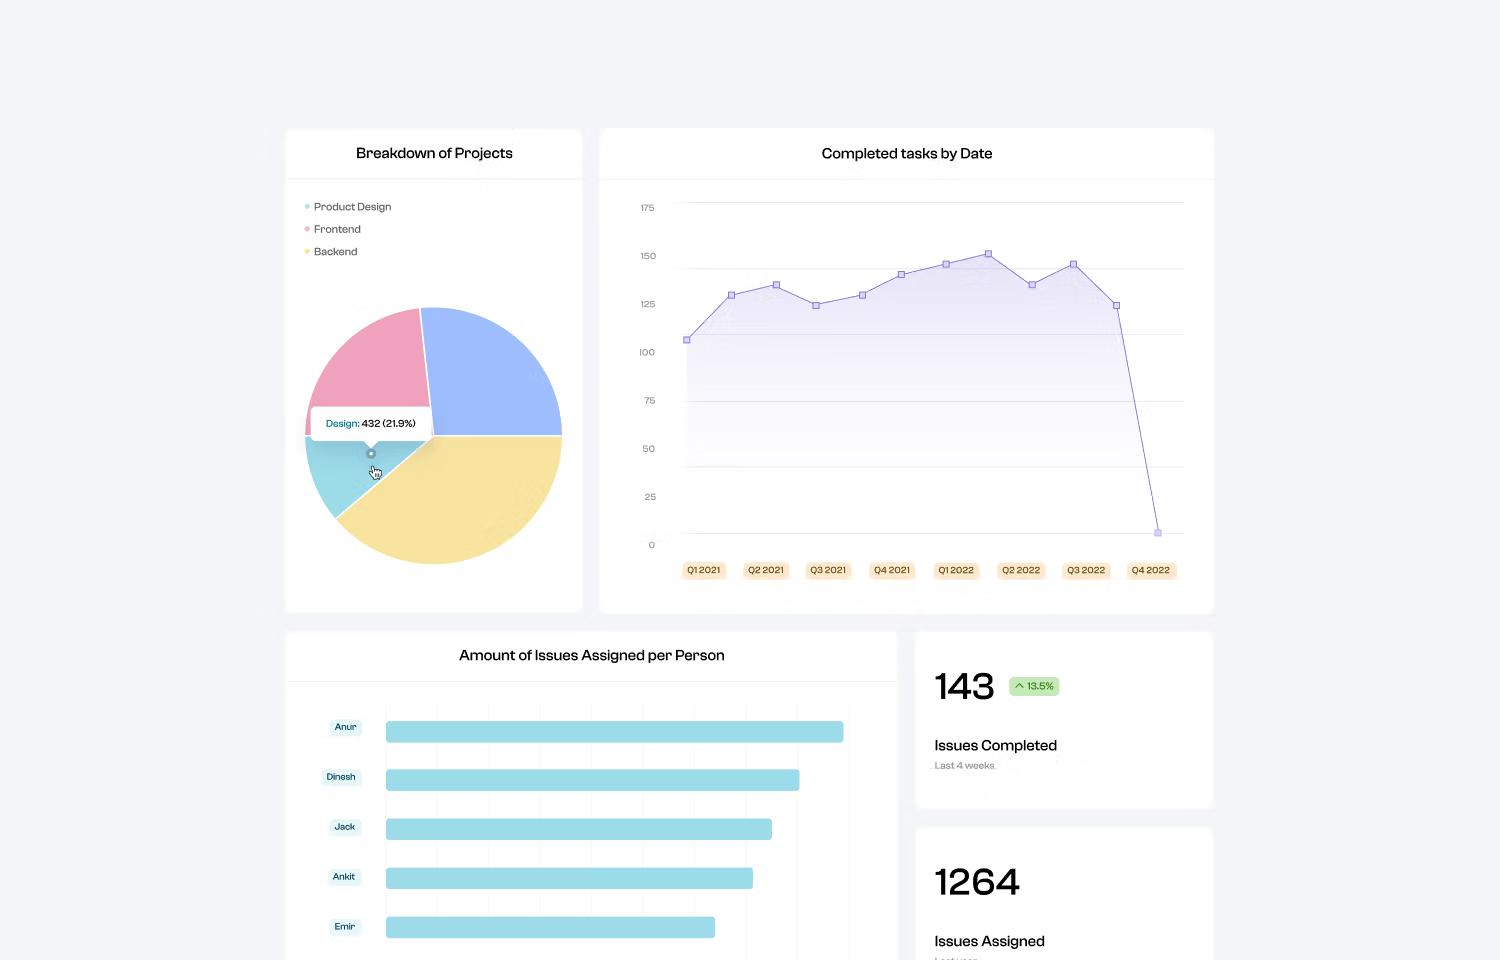
Polymer provides instant insights into your task management like team productivity KPIs, trends, & where time is spent each week. You’ll have access to a template and several visualization suggestions that can be used as is or customized to your liking! These can be shared via weblink or embed & automatically updated for regular reporting.
How it works
Connecting Linear data to Polymer is an easy process - just create a Polymer account, choose Linear as the data source, & authenticate Linear login credentials. Polymer will immediately pull in & present your Linear data.
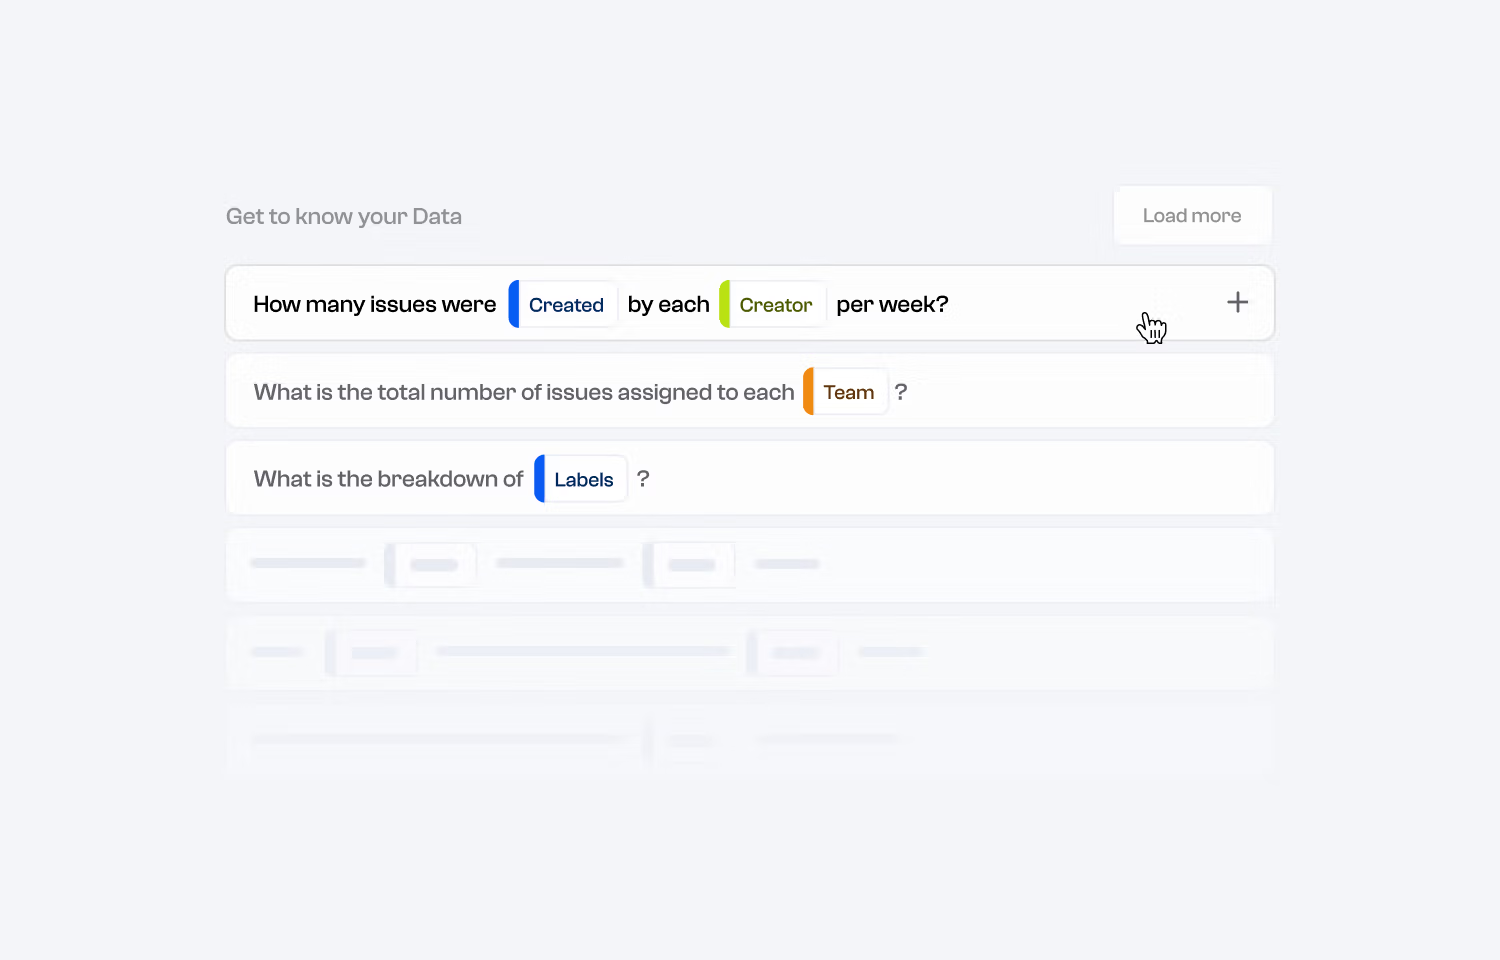
You’ll start out in Polymer's Insights tab where you are presented with suggested questions you can ask about your data along with an answer via visualization that can be added to your dashboard. Additionally, a pre-built template based on Polymer's Linear reporting in the “Boards” tab that can be used as is or as a jumping off point for further discovery.
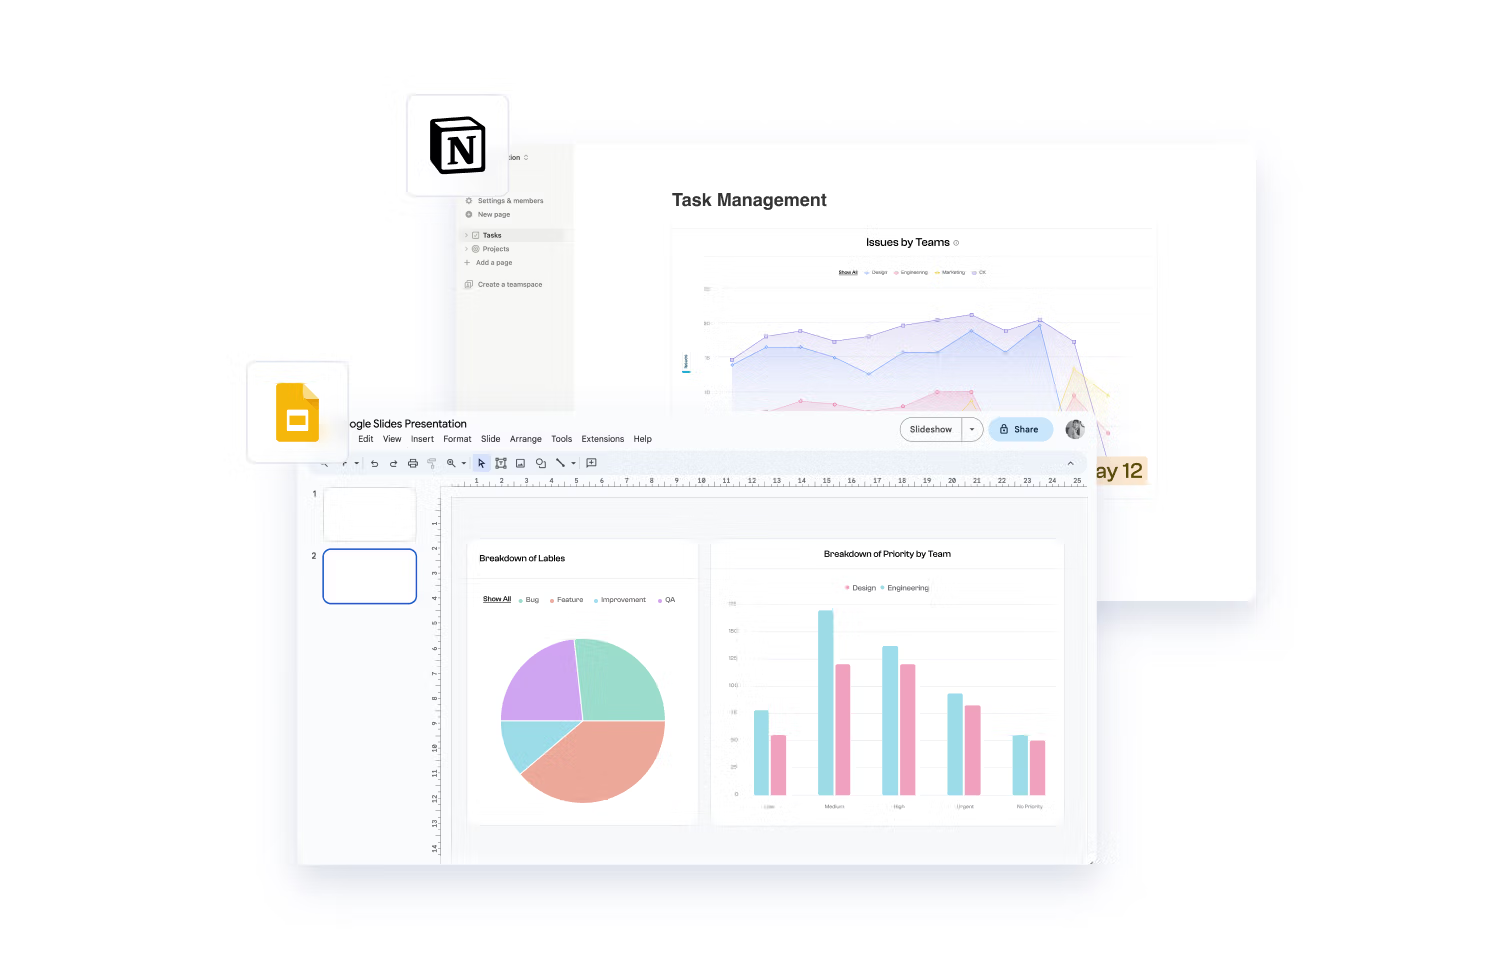
To collaborate on analysis & storytelling with other team members, invite them to the workspace using the “Add Collaborator” button in the bottom left corner of the workspace. To share a final dashboard, copy & share the link to the board or copy its embed code and add it to a Notion doc or other website.
Configure
Any member of your team with Linear access can create a Polymer account, no credit card required. You’ll just connect Linear as the data source, authenticate, & start working with the data. Upon account creation, there will be a free trial period to explore the tool. After this period, to continue getting access to your dashboard or any new analysis & updates, you can opt to sign up for a paid plan.