Linear Preview: Roadmap Timeline
Linear Preview: Roadmap Timeline
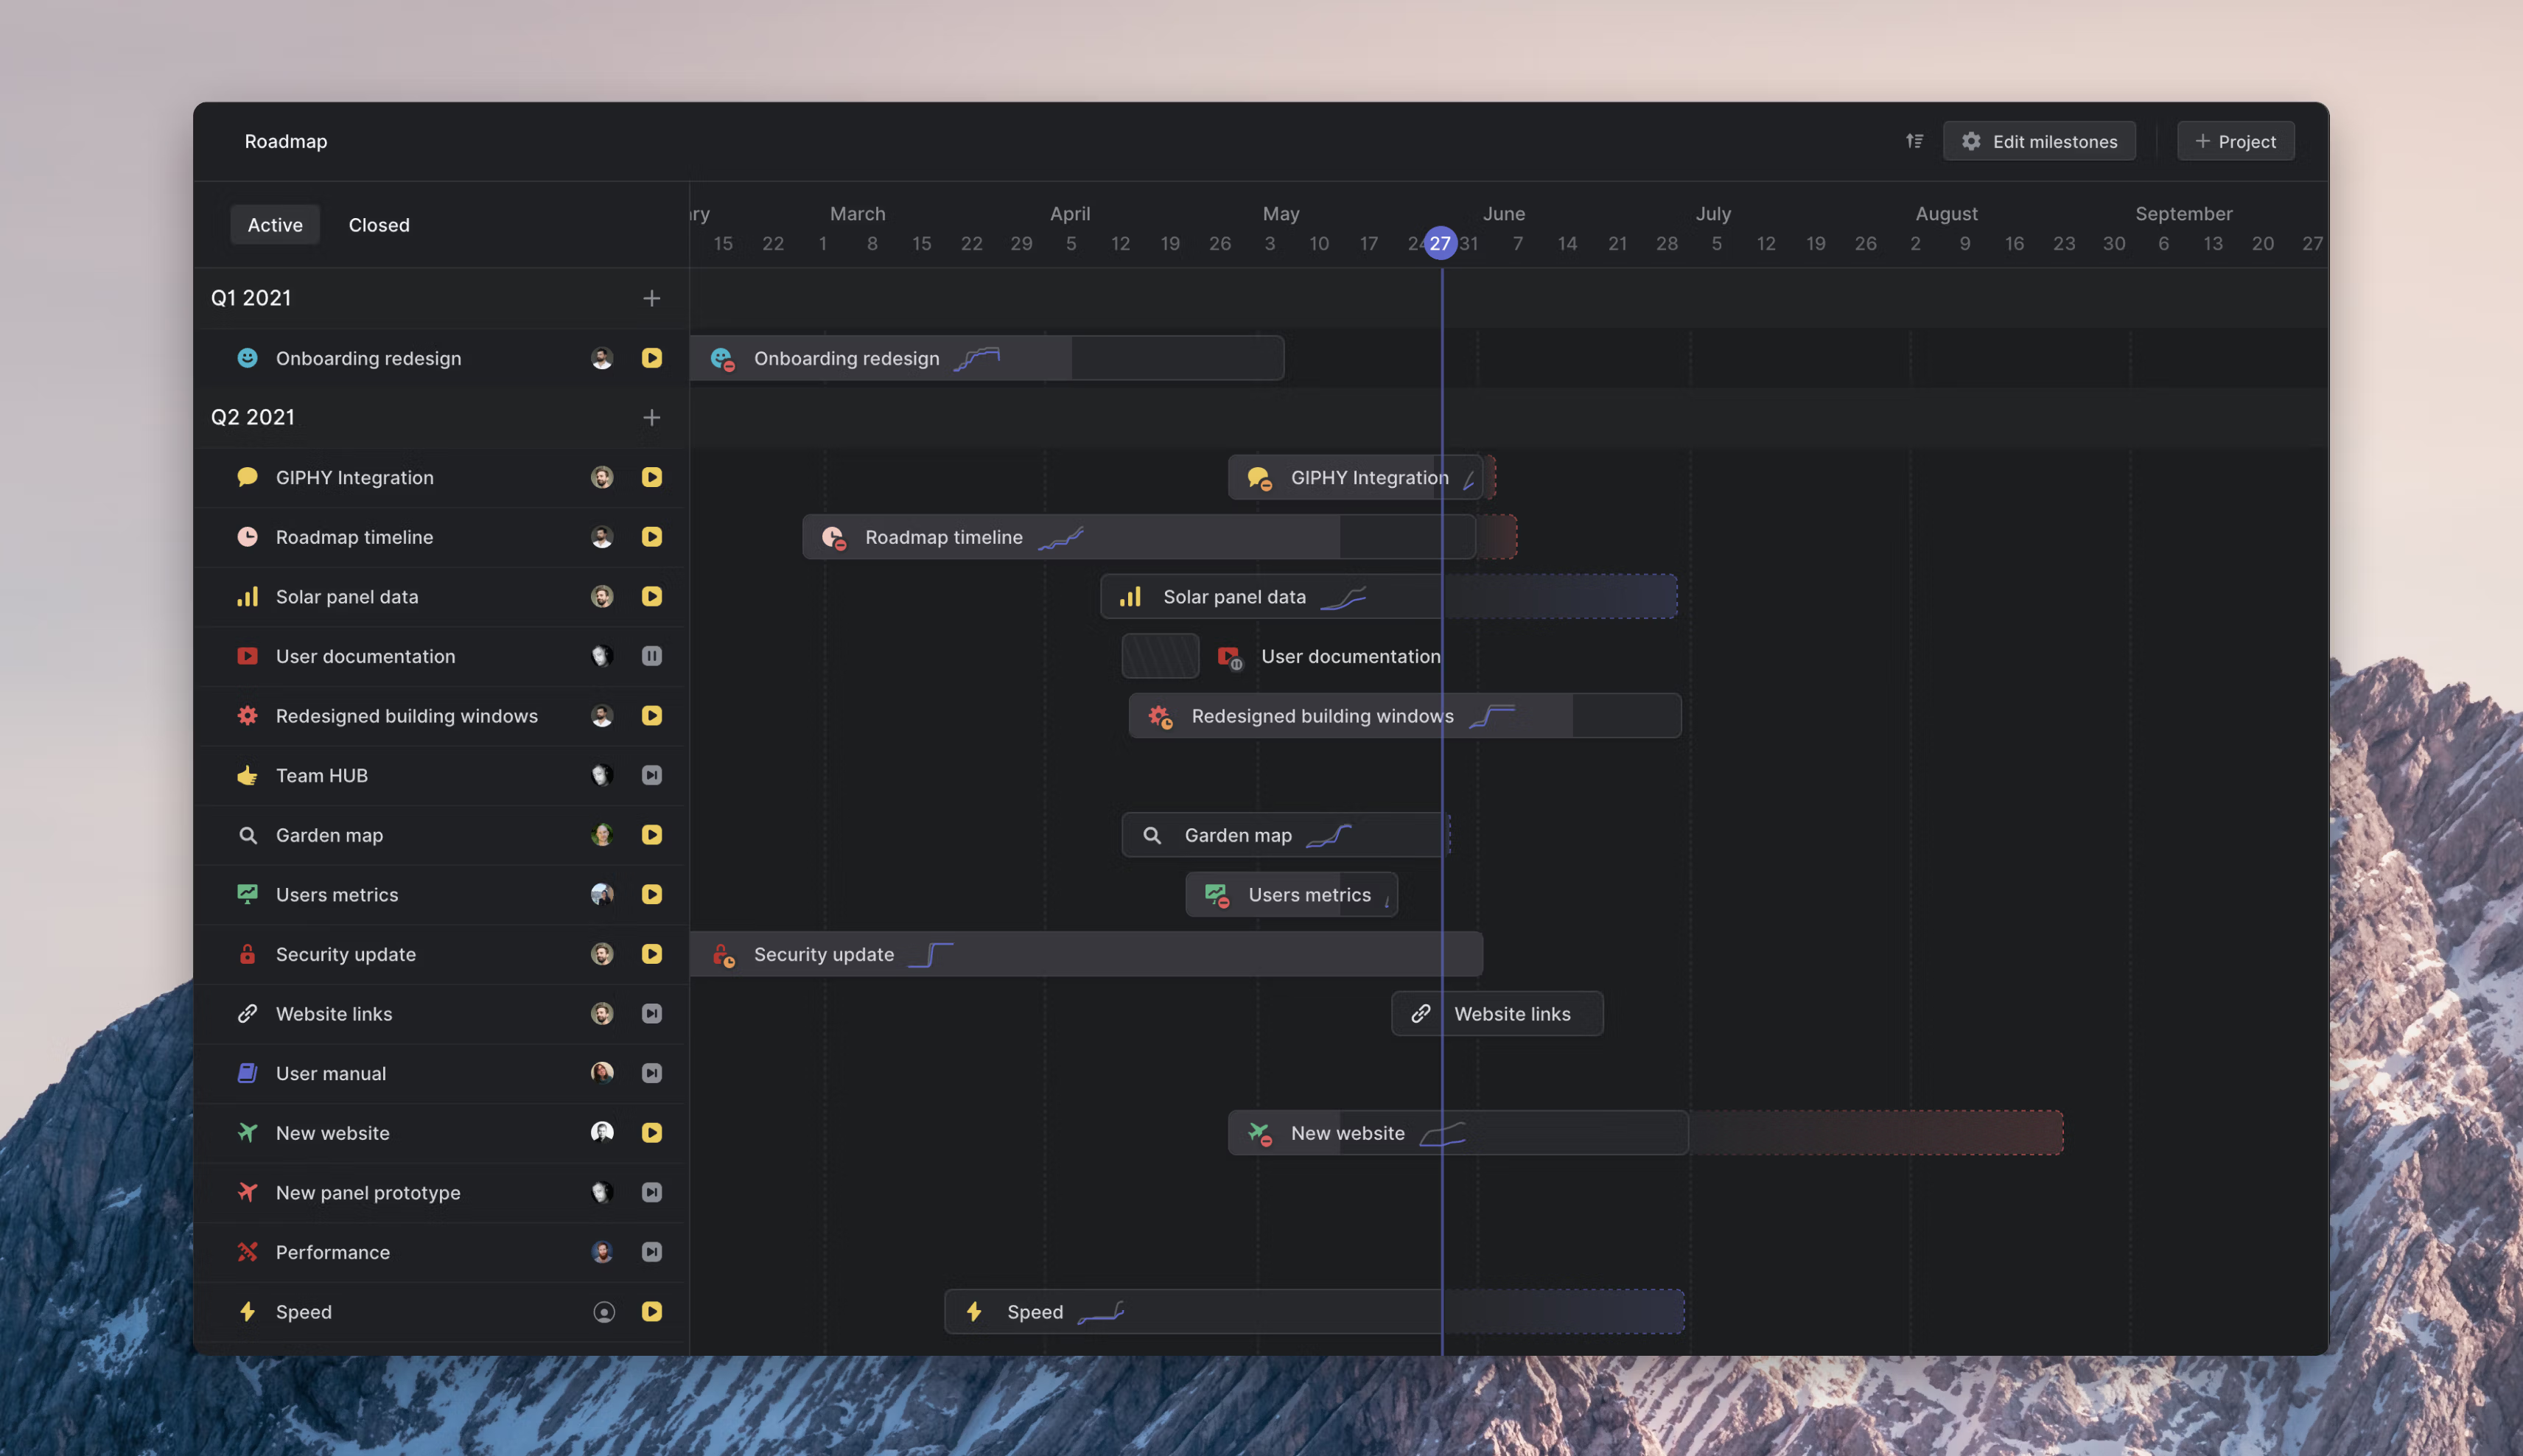
Today we’re launching a timeline visualization of your project roadmap in Linear. You can now plan, manage and track what needs to get done this month, quarter, and year, visually. With the roadmap timeline, see a high-level view of not just the projects in your organization but also the progress teams are making toward them and estimates for when projects will complete. It’s a smart timeline synced to actual issue data that helps you avoid flying blind.
Planning with timeline
Viewing projects in the context of time gives you a better understanding of what’s going on and when projects will complete. It’s also easier to plan for dependencies, such as when someone will free up to work on a new project, and spot projects that are falling behind or where teams may need more time or to adjust the scope.
Draggable project bars let you quickly make changes to your roadmap. Move the project to adjust the start date, extend or shorten the project length, and move the project up or down on the roadmap to reprioritize the work compared to other projects. Any updates made on the timeline will sync across the workspace. Especially early on in the planning phases, you’ll have a lot of back-and-forth discussions on projects. The timeline view makes it easier to collaborate live since everyone can see the same view, understand the visual design intuitively, and any changes update near instantaneously on everyone else’s screen.
Live predictions
While a project is active, we’ll generate an estimated completion date and show the projected date range on the timeline. These are the same estimates you see on project graphs and we calculate them using remaining issues and historical project velocity. A purple estimate shows up if the project has no set target date to give you a hint of when the project might complete, and a red estimate means the project is or is projected to take longer than the defined target date. The predictions take some time to generate after the project begins since they require recent project data, so you may need to wait a few days before it shows up. This live forecast gives you realistic and up-to-date information that you can use when making decisions on scope and planning.
✨ ProTip: To see a specific project’s graph without leaving the roadmap, press the Space to launch peek while hovering over the project on the list or timeline.
Roadmap Timeline is available as a Linear Preview feature while we polish the last details. To enable it for your organization, press ⌘K and search for Timeline.
Fixes and improvements
- Fixed a bug in template selection menus in team settings
- Fixed git branch names for issues containing ⌘
- Fix a bug when dragging list items in Firefox
- Fixed a bug so that you can now switch to another workspace after scheduling your current workspace for deletion and logging in again
- Improved discovery for editor related keyboard shortcuts
- Improved the assignee selector in board issue cards
- Parent issue is now maintained when creating multiple issues
- Images will no longer be duplicated when dragged from one position to another within the editor in Safari
- Images can now be dragged and reordered within the editor
- Added the option to order lists by issue due date
- Added more options for auto-archiving for teams using the Linear free plan
- Fixed a bug that prevented file uploads on iOS
- Long workspace names are now properly truncated in the sidebar workspace menu
- Fixed a layout glitch when first rendering the search results.