Dashboards
Dashboards let you bring together insights from across teams and projects onto a single page. Use them to track key metrics, monitor trends, and explore data in one place.
Available to workspaces on our Enterprise plans.
Overview
Dashboards help teams stay aligned by surfacing key data in one centralized view.
You can use dashboards to:
- Track metrics across multiple teams and projects
- Combine charts, metric blocks, and tables in a single layout
- Filter each insight independently to customize what’s shown
- Explore data directly by clicking into charts and metrics
Creating dashboards
Dashboards can be created in multiple ways:
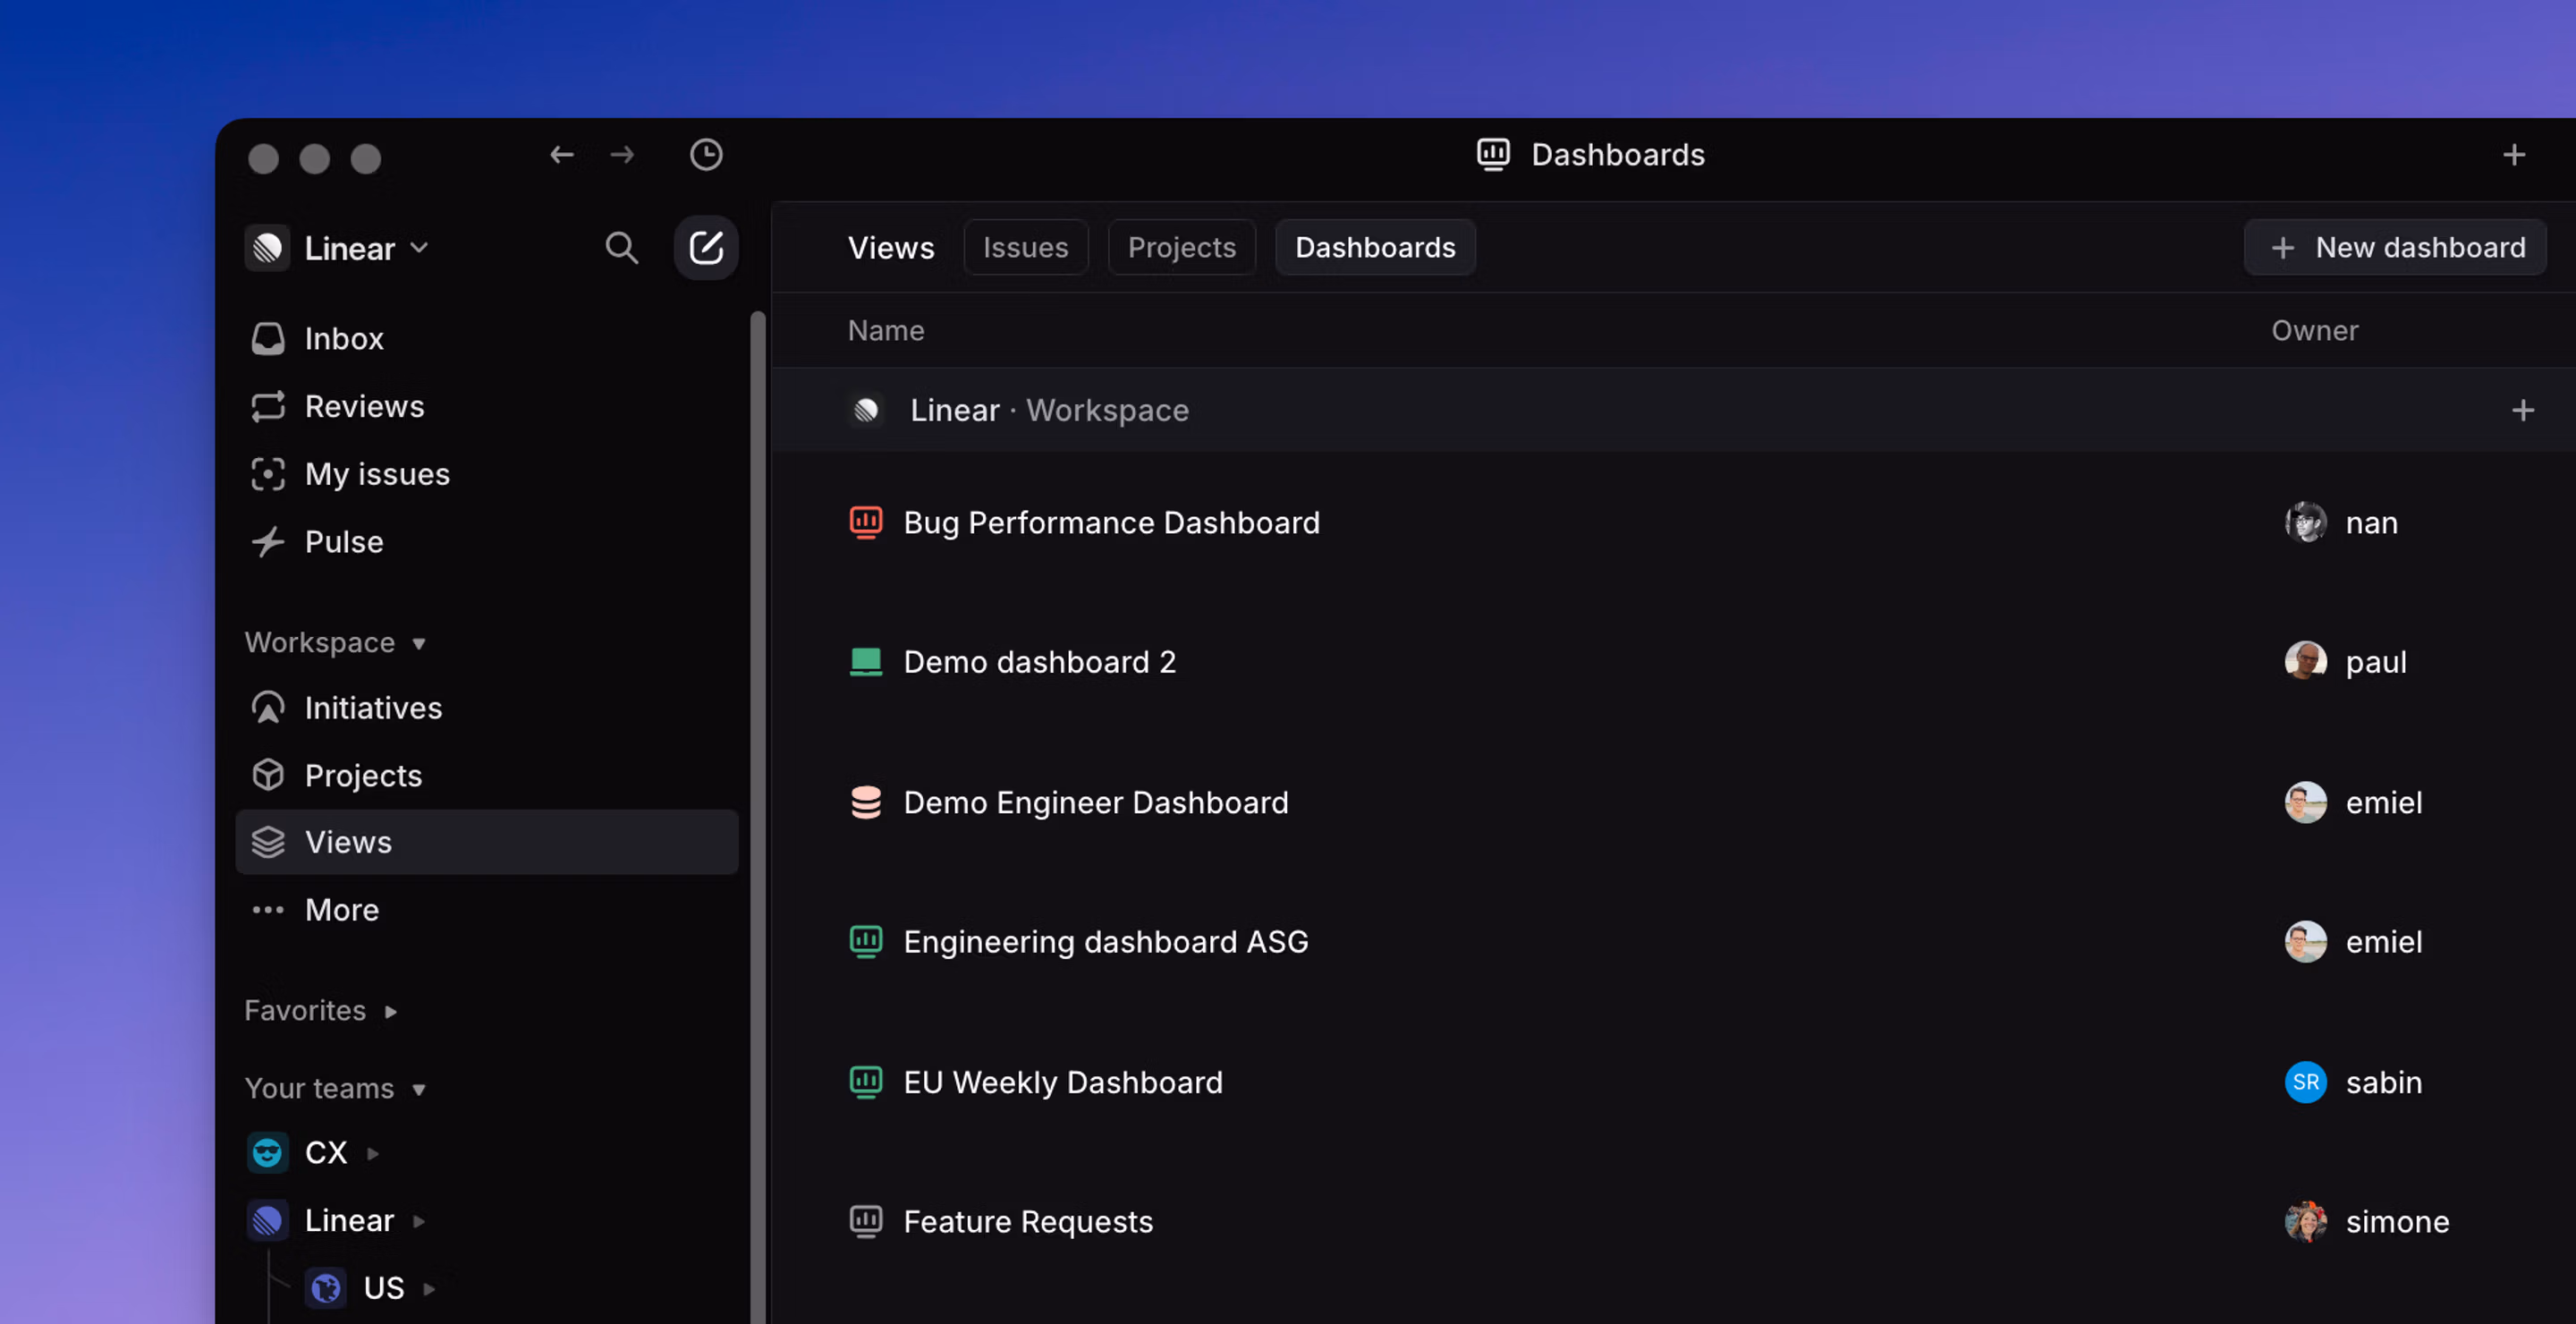
- From the Dashboards tab in the workspace Views page or a team’s Views page: Navigate to the Views page for your workspace or a team, select the Dashboards tab, and choose “New dashboard”.
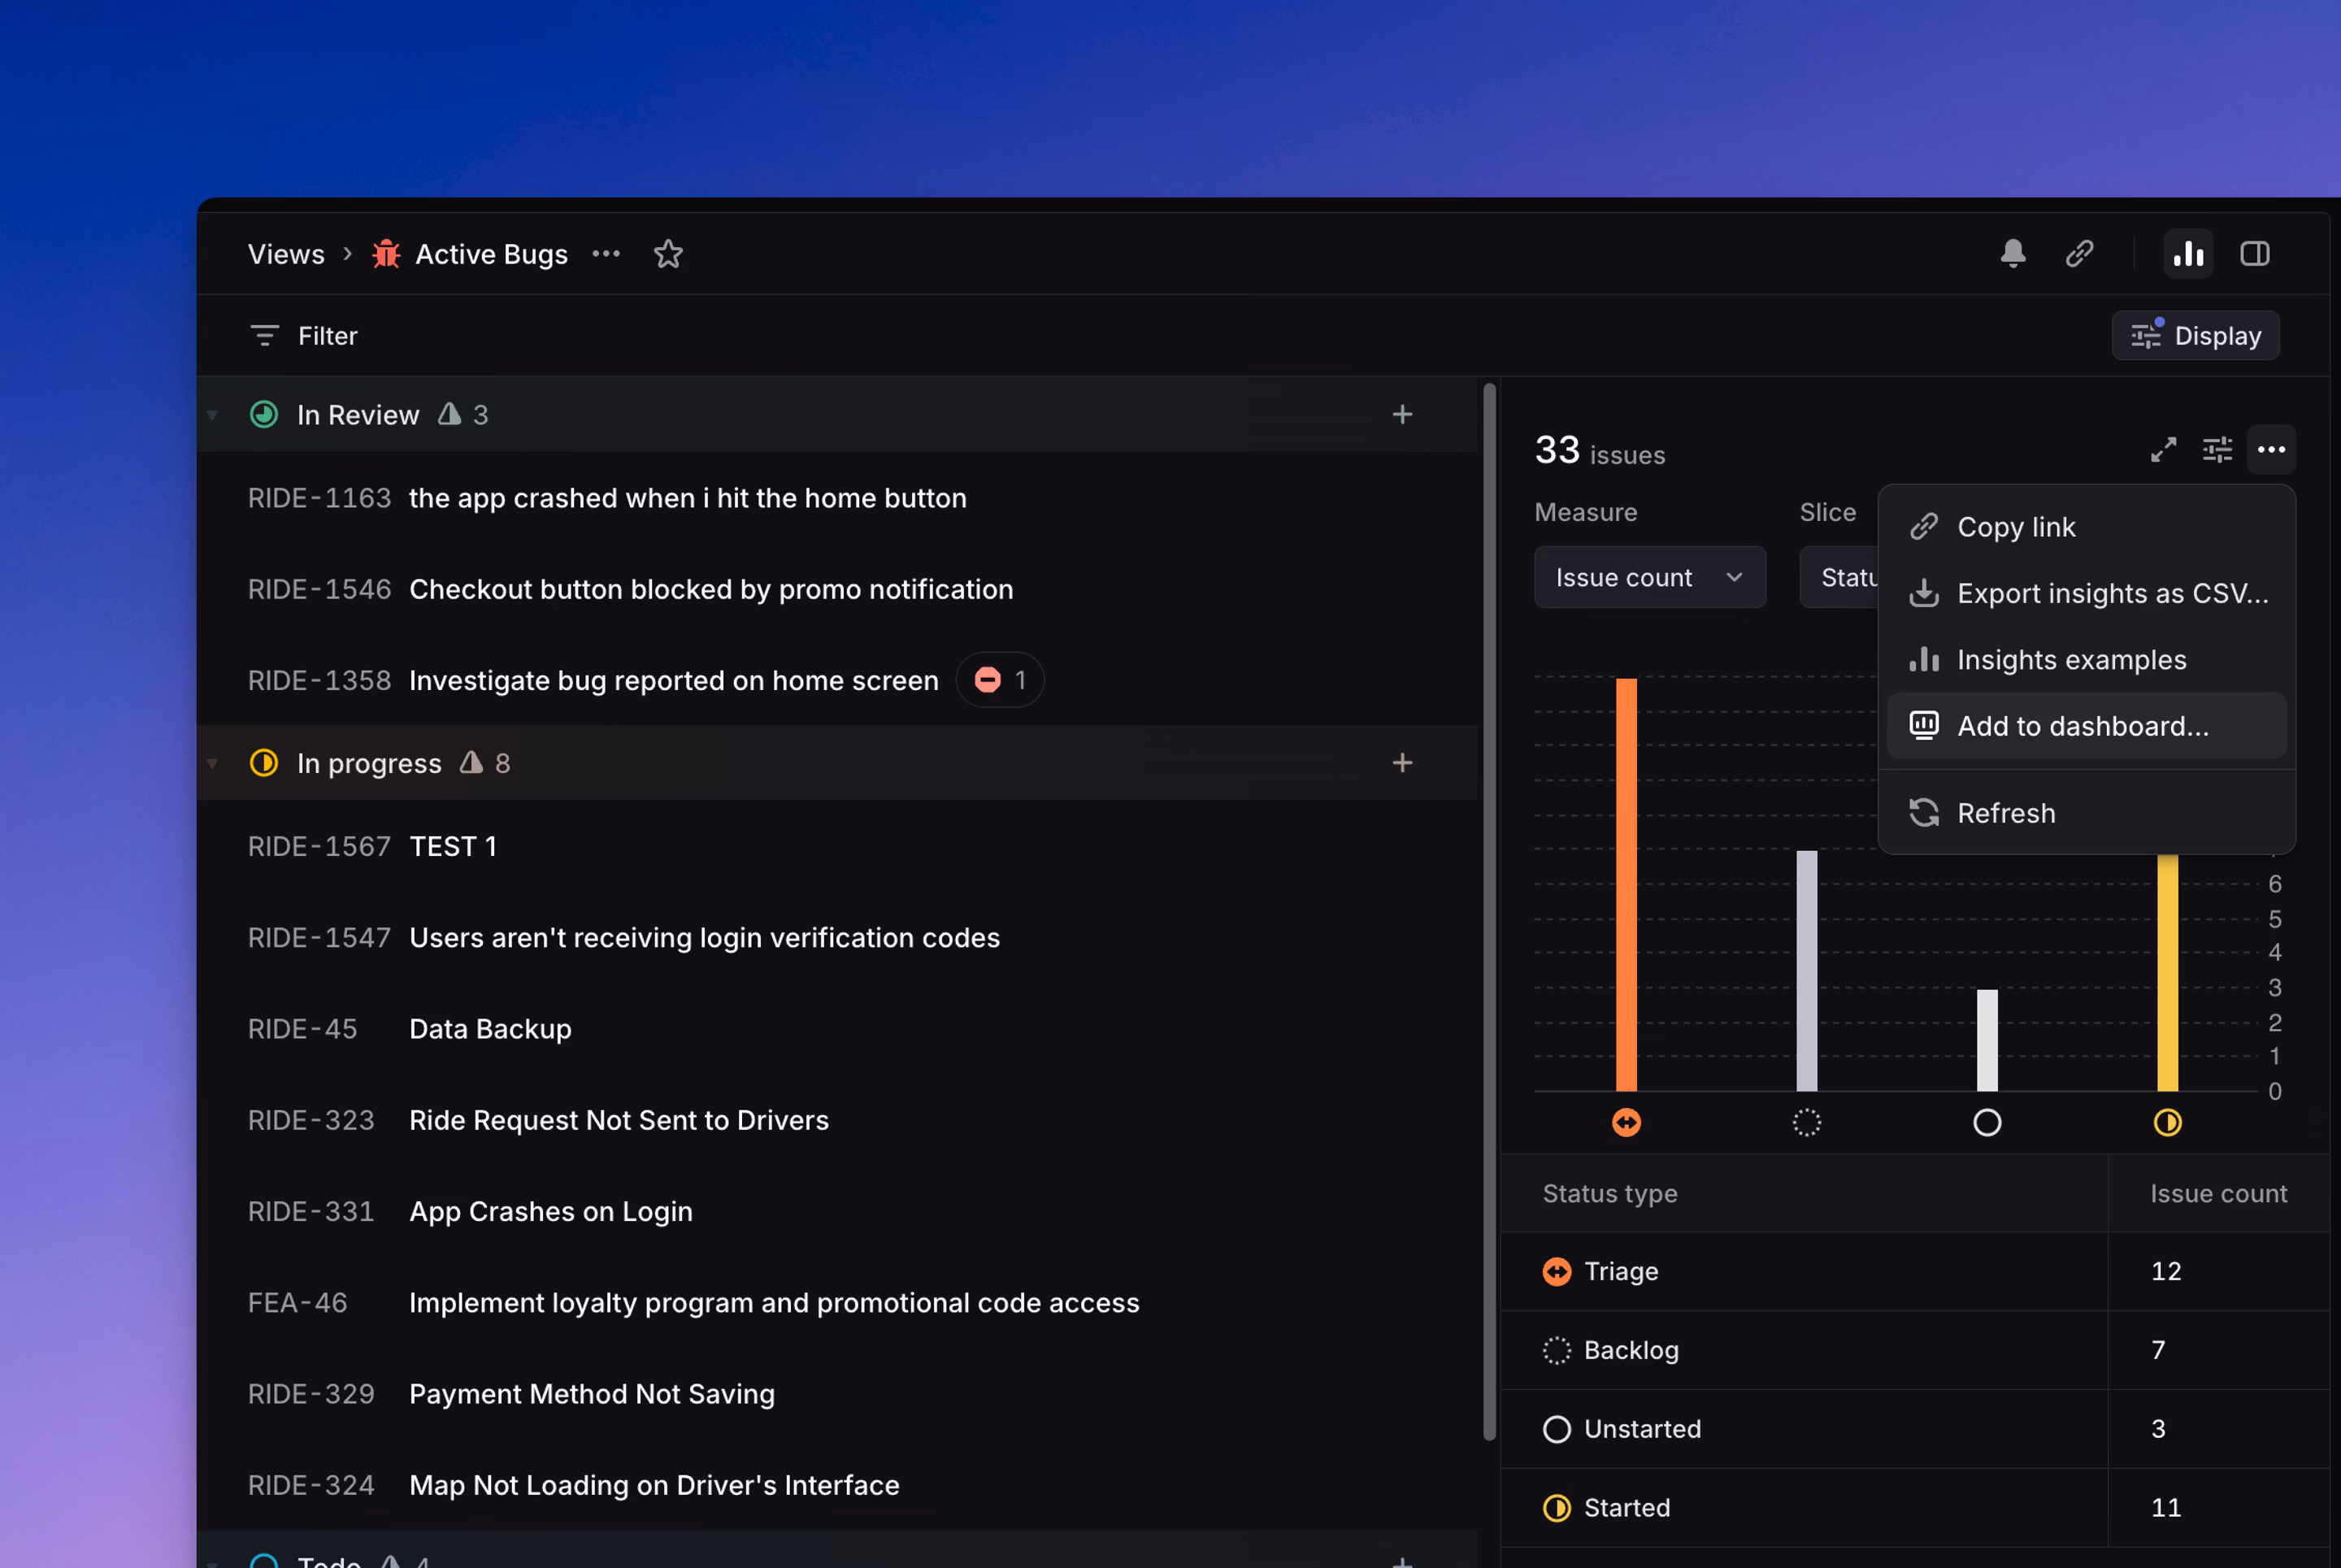
- Directly from an existing insight: When viewing an Insight inside a View, open its context menu and select “Add to dashboard” to create a new dashboard or add it to an existing one.
Insights can be included on multiple dashboards.
Using dashboards
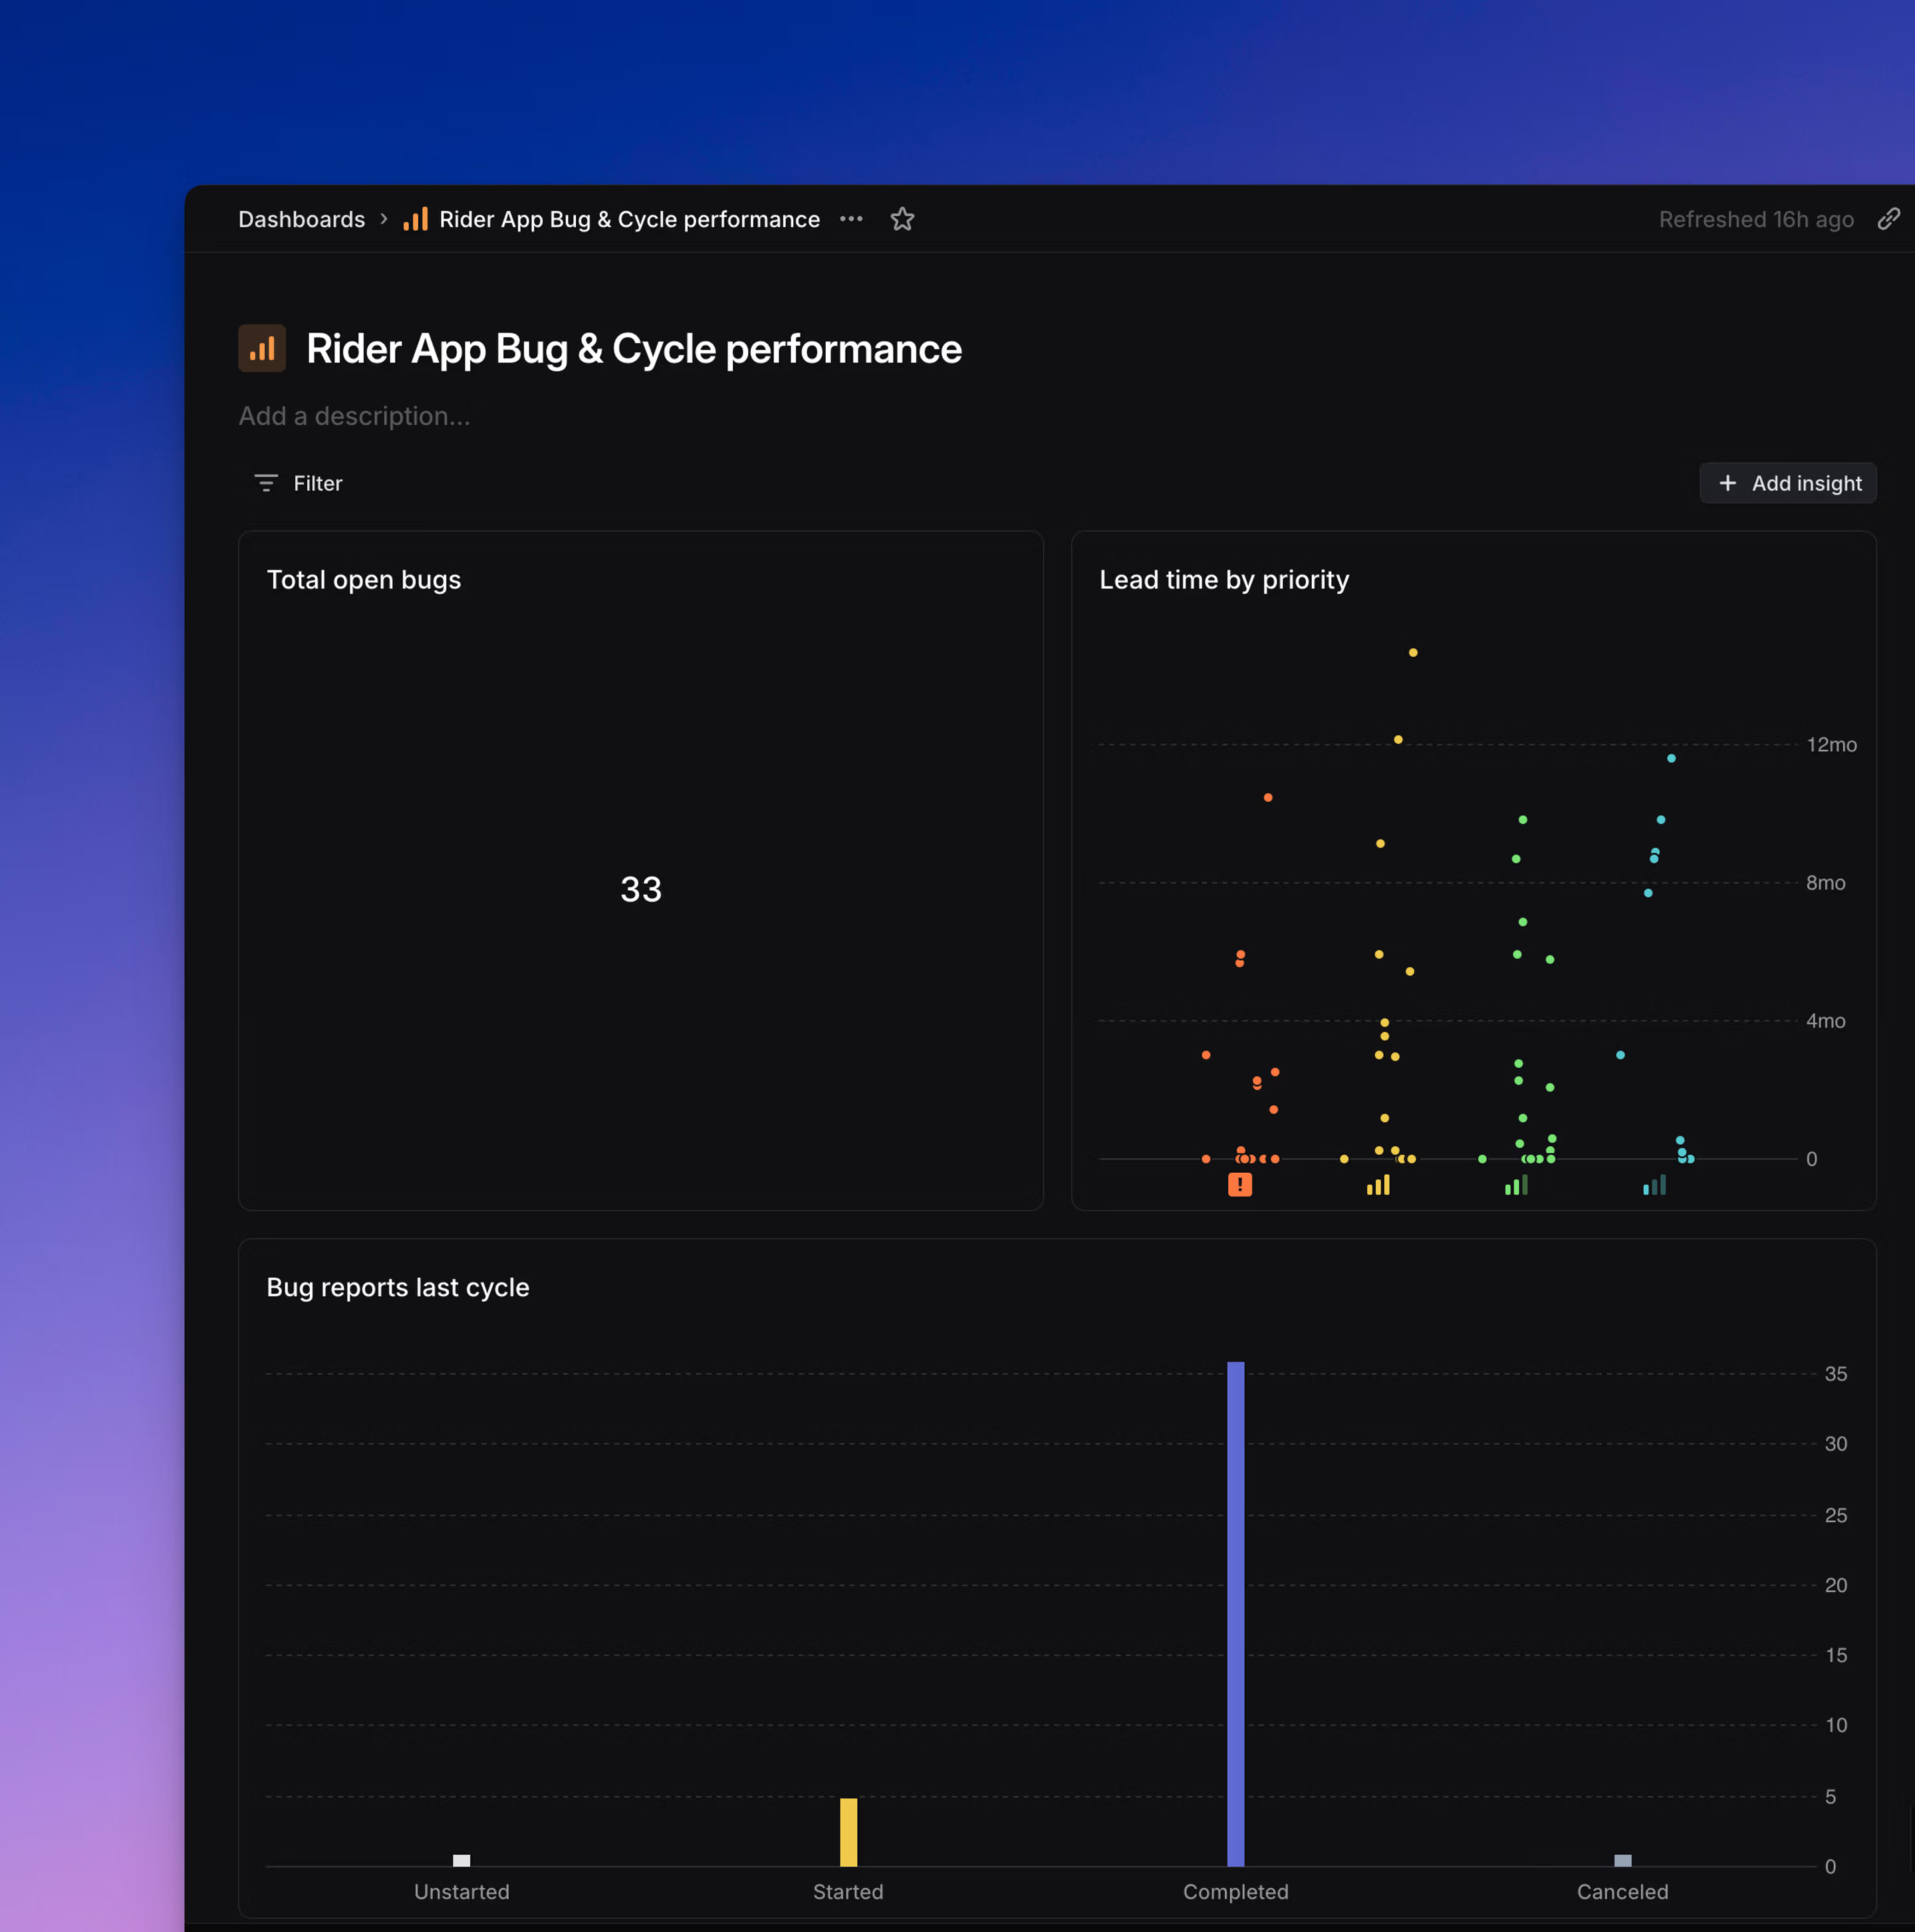
Each insight added to a dashboard can be:
- Displayed as a chart, table, or metric block
- Individually filtered to customize the data shown
- Explored directly — click any slice or metric to open a filtered view of the underlying issues.
This makes dashboards useful both for high-level overviews and deeper analysis, without needing to navigate away from the page. The formats supported on dashboards — charts, metric blocks, and tables — are the same as those available in Insights.
Filtering dashboards
Dashboards support flexible filtering to help you tailor what data is shown:
- Dashboard-level filters: When you create or edit a dashboard, you can set filters that apply globally to all insights in that dashboard. For example, if you filter for issues created by the “Design” team, every insight on that dashboard will reflect that filter automatically. You can configure multiple filters, and once the dashboard is saved, you can optionally hide these dashboard-level filters from view using the “saved filters” button to reduce visual clutter; this does not affect whether they apply.
- Insight-level filters: In addition to dashboard-level filters, individual insights on a dashboard can have their own filters. These filters apply only to that specific insight and can further refine the data it shows. For example, one insight might add a filter for a particular label or project while another shows all issues.
- Filters when adding existing insights: If you add an existing insight (e.g., from a View) to a dashboard, that insight will automatically inherit the dashboard-level filters. This means the insight may look different when viewed inside the dashboard than when viewed in its original View, since it will reflect both its own filters and any global filters set at the dashboard level.
Managing dashboards
Each dashboard has an owner, which is typically the person who created it. Ownership can be changed at any time from the context menu beside the dashboard name.
You can also move a dashboard to another team, the workspace, or your personal dashboards using the “Move to…” option in its context menu. When a dashboard is moved to Personal, it will appear in the Dashboards tab on the workspace-level Views page, under a separate “Personal dashboards” heading. These dashboards remain visible only to you.
To ensure you’re viewing the most recent data within a dashboard, use the Refresh data option in the context menu.
Private teams
Dashboards have limited support for private teams. By default, workspace-level dashboards do not include data from private teams. To include insights from a private team, a dashboard must either be created inside that team or moved to your personal dashboards.