Roadmaps
Roadmaps [deprecated] organize your projects and align your company on the path ahead.
Overview
Note: Roadmaps have been replaced by Initiatives. This article is now archived.
Roadmaps add a high-level structure that organizes projects in your workspace. Create custom roadmaps to organize work in a single team or across your workspace.
Roadmaps help you make decisions and plan as you see projects and their expected completion dates on the timeline. The roadmap also gives meaningful context to daily project work which can help motivate the team members doing it.
Roadmaps are accessible to members and Admins. As a workspace level feature, Guests cannot view Roadmaps.
Configure
Go to workspace Roadmaps settings to turn on roadmaps for your workspace. Once you do, the Roadmap icon will appear in the lefthand side bar, under Views.
You can choose the first month of the fiscal year if needed, which is used when grouping projects by quarters, half-year and year.
Basics
Create roadmaps
To create your first roadmap, open the Roadmaps page from your sidebar and press the + icon to the right of "All Projects". If you don't see this icon, you've likely already created roadmaps on your workspace and you can create a new roadmap through the overflow menu to the right of your existing roadmaps.
The All projects page shows you every project in your workspace. From there, create custom roadmaps each with their own curated list of projects. For example, you could create a team-specific roadmap or one that includes projects slated for an upcoming launch.
Projects can be part of multiple roadmaps. Add a project from the roadmap or from the project details sidebar in the project view.
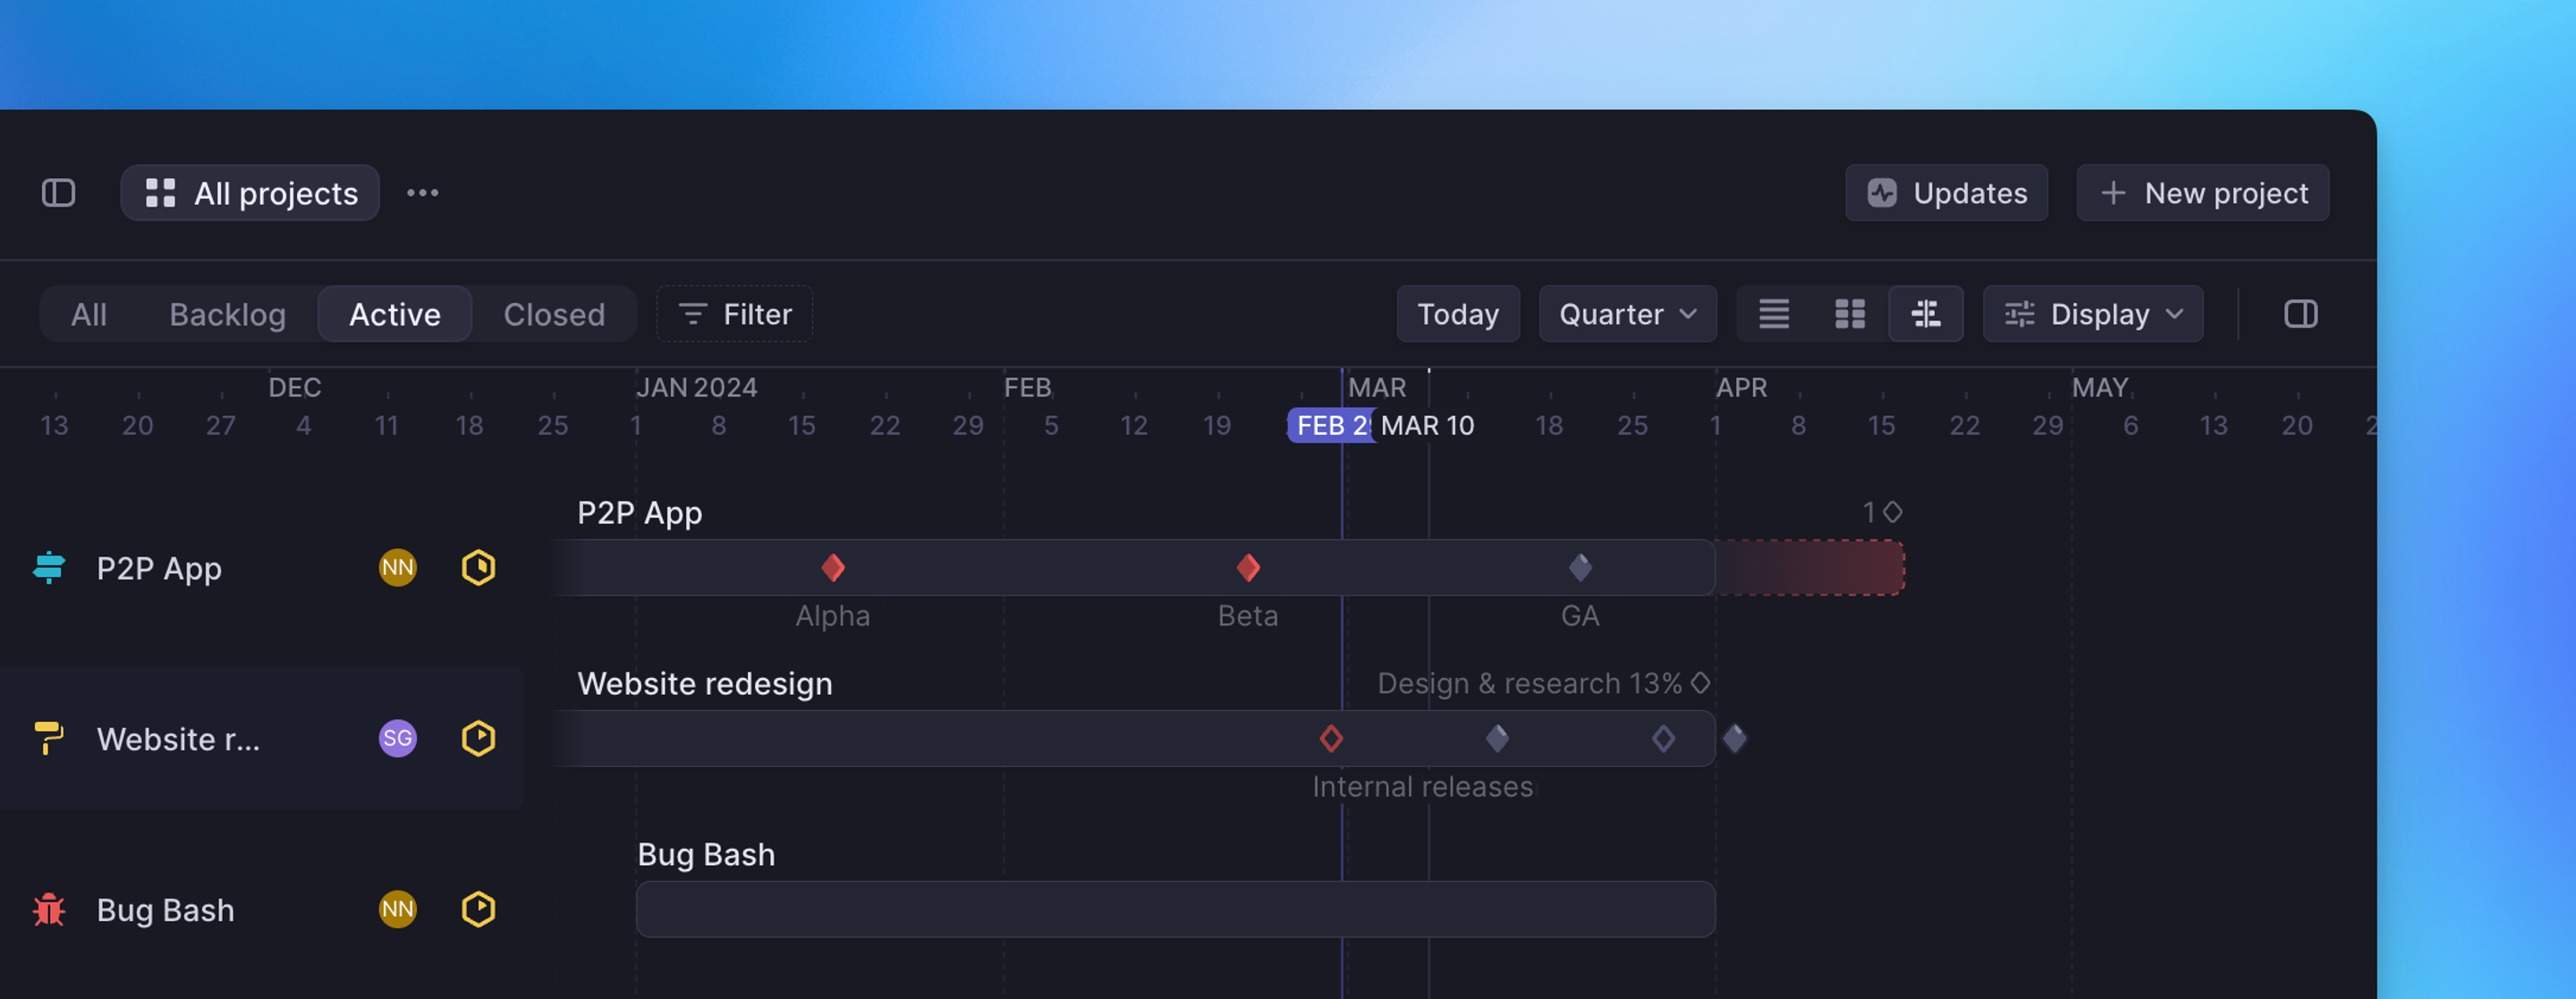
Timelines
Roadmaps and project views can be viewed as lists, boards or timelines. Toggle between these options using the selector to the left of Display.
Timelines prioritize clearly displaying start and target dates, along with your milestones (displayed with diamond icons at each milestone's target date.) Optionally, show cycles as well from Display settings.
You can change a milestone's target date from the timeline view by dragging it to a new date. Select individual milestones to move them, or if they appear together, hold Shift to drag all milestones to a new date. Dragging a project to change its start and target date will move the milestones along with it, but you can hold Cmd/Ctrl to keep milestones in place. Right-click on the project to add a new milestone.
To work even more efficiently with timelines, consider using:
- A display option to show the project list, which can be hidden with Shift [ to get more space
- Shortcuts to leap to Today or change the zoom to Year, Quarter, or Month
- A display option to hide prediction bars to reduce clutter and take cleaner screenshots for status reports
Lists and Boards
When granular displays of dates associated with projects aren't your priority, consider viewing Roadmaps as Lists or Boards. Boards are particularly useful for planning purposes and allow the display of crucial data in card format. If you manually order roadmaps, Boards also it easy to drag and drop projects between columns.
Lists are dense and simple for viewing projects on a roadmap without unnecessary distractions.
Learn how we designed and built our first iteration of the timeline view in this video with the Linear team.
View by project status
The All tab shows all projects on the roadmap. The Backlog tab shows any projects with that status. Planned and In Progress projects show up under the Active tab. Closed projects include those that have been completed or cancelled. The roadmap will open on the tab you last selected.
Project Peek
Our beloved Peek feature works for projects, too. Press Space to view project details. Learn more about Peek.
View Options
View the timeline in monthly, quarterly, or yearly timeframes. Dates display at the top in weekly intervals, based on a Monday to Sunday schedule and weekends are shaded out in the background.
Order projects manually, by last created, or by last updated. You can also group projects by project lead or status.
Filters
Filter any roadmap by these properties: status, content, lead, members, teams, created date, start date, updated date, target date, and health.
Roadmap Details
In any roadmap you can press CTRL/CMD+I to open the roadmap details pane.
This pane will show you an overview of the roadmap and its projects. The Roadmap Owner, project count and teams associated with the roadmap will be listed here. If using estimates, the scope will also be broken down here by team.
Scope is represented in the horizontal bar graph as completed points per team. If a filter is applied, this value displays instead as completed points per team with the current filter/completed points per team with no filters applied.
The bubble graph shows a project's scope through the bubble's size, its velocity on the y axis and its progress on the x axis. White bubbles represent planned projects, and yellow bubbles represent projects in progress.
Roadmaps compared to project views
Roadmaps are manually curated lists of projects. To add or remove projects after creation, you will need to manually edit the roadmap. If you would rather have projects automatically added and removed based upon selected filters, you can use project views instead.