Dashboards (beta)
Dashboards let you bring together insights from across teams and projects onto a single page. Use them to track key metrics, monitor trends, and explore data in one place.
Available to workspaces on our Enterprise plans.
Overview
Dashboards help teams stay aligned by surfacing key data in one centralized view.
You can use dashboards to:
- Track metrics across multiple teams and projects
- Combine charts, metric blocks, and tables in a single layout
- Filter each insight independently to customize what’s shown
- Explore data directly by clicking into charts and metrics
Dashboards are currently in closed beta and available on Enterprise plans only. The feature is still in active development, and we’re monitoring usage closely to refine the experience and expand capabilities.
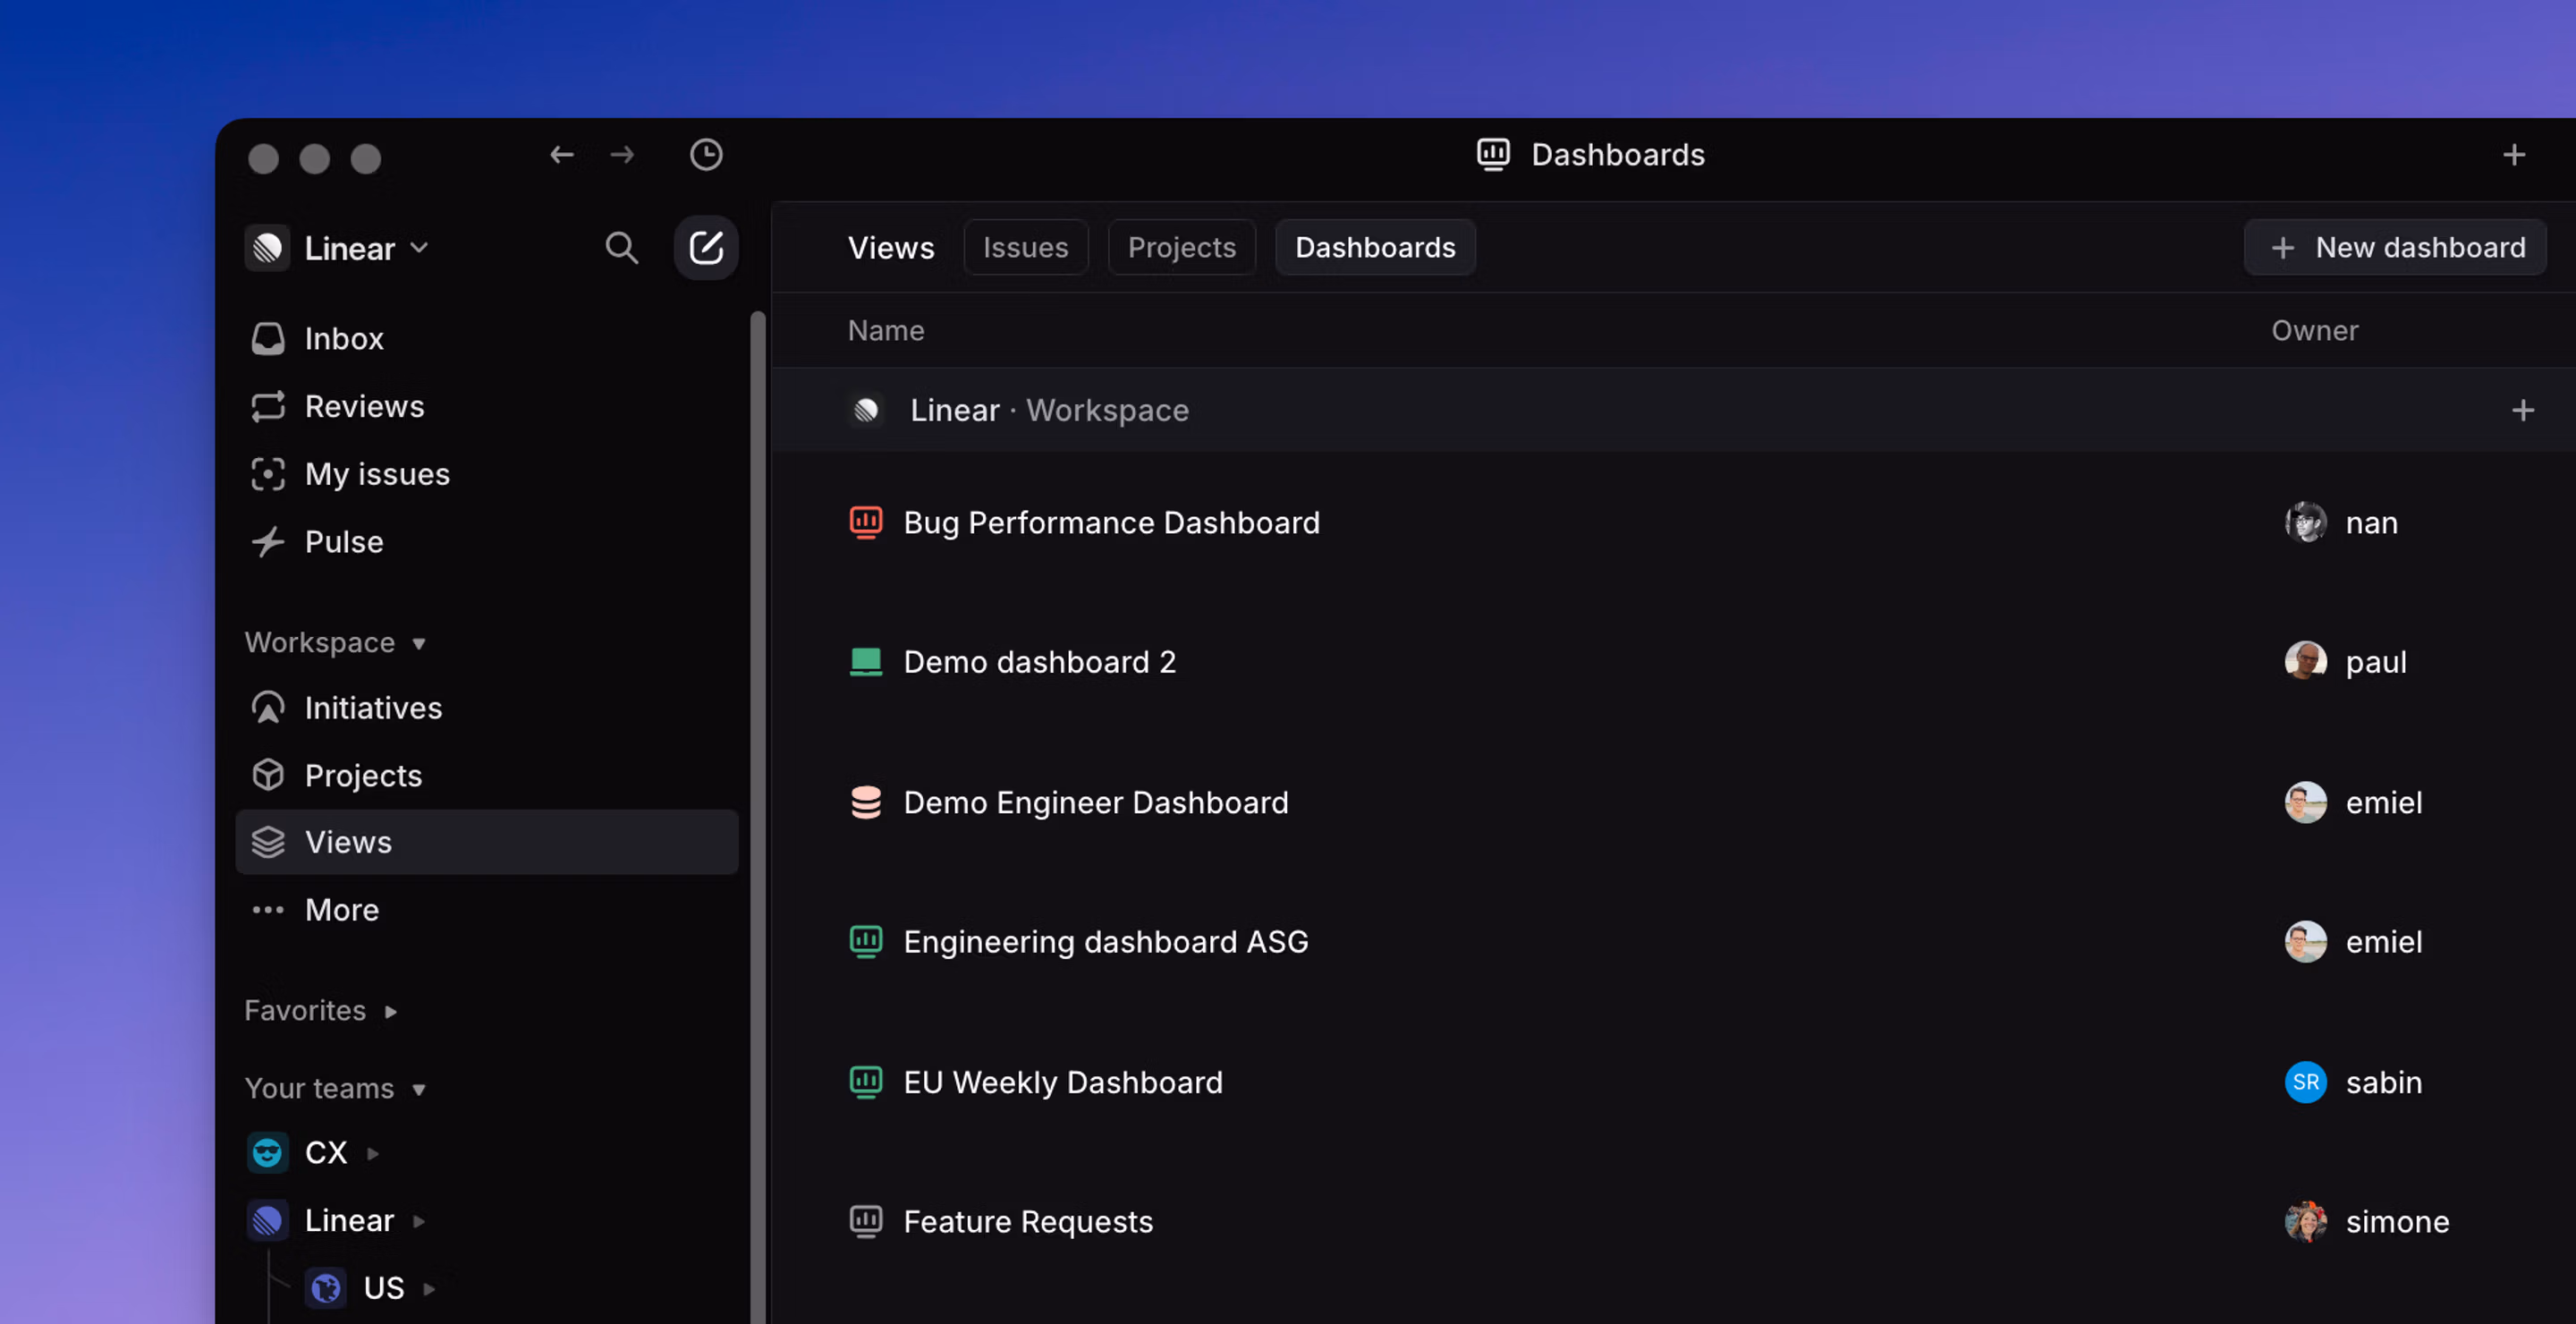
Creating dashboards
You can create dashboards from either the Views section of your workspace or directly from an insight. To create one from Views, navigate to the Dashboards tab and choose the option to create a new dashboard. If you’re already working with an insight, you can open its context menu and select “Add to dashboard” to create a new dashboard or add it to an existing one. Insights can be included on multiple dashboards if needed.
Using dashboards
Each insight added to a dashboard can be:
- Displayed as a chart, table, or single metric
- Individually filtered to customize the data shown
- Explored directly — click into any slice or metric to view the underlying issues without leaving the dashboard
This makes dashboards useful both for high-level overviews and deeper analysis, without needing to navigate away from the page.

Managing dashboards
Each dashboard has an owner, which is typically the person who created it. Ownership can be changed at any time from the context menu beside the dashboard name. You can also move a dashboard to a different team or to the workspace level, depending on who needs access to it.
Dashboards can be favorited for quick access. Favorited dashboards will appear in your personal sidebar, even if they’re owned by another team or the workspace.
To ensure you’re viewing the most recent data within a dashboard, use the Refresh data option in the context menu.
Private teams
Dashboards currently have limited support for private teams. Workspace-level dashboards do not include data from private teams by default. To include insights from a private team, the dashboard must be created inside that private team or set as private to you. Broader private team support is in development and will be available soon.
Feature availability
Dashboards are only available on Enterprise plans. The formats supported on dashboards are the same as those available in Insights. At this time, no additional chart types or metric formats are included. We’re tracking customer feedback and may expand support in future iterations.
Dashboards are still in active development. We’re continuing to refine the experience, address edge cases, and improve support for more use cases as we gather feedback from early adopters.